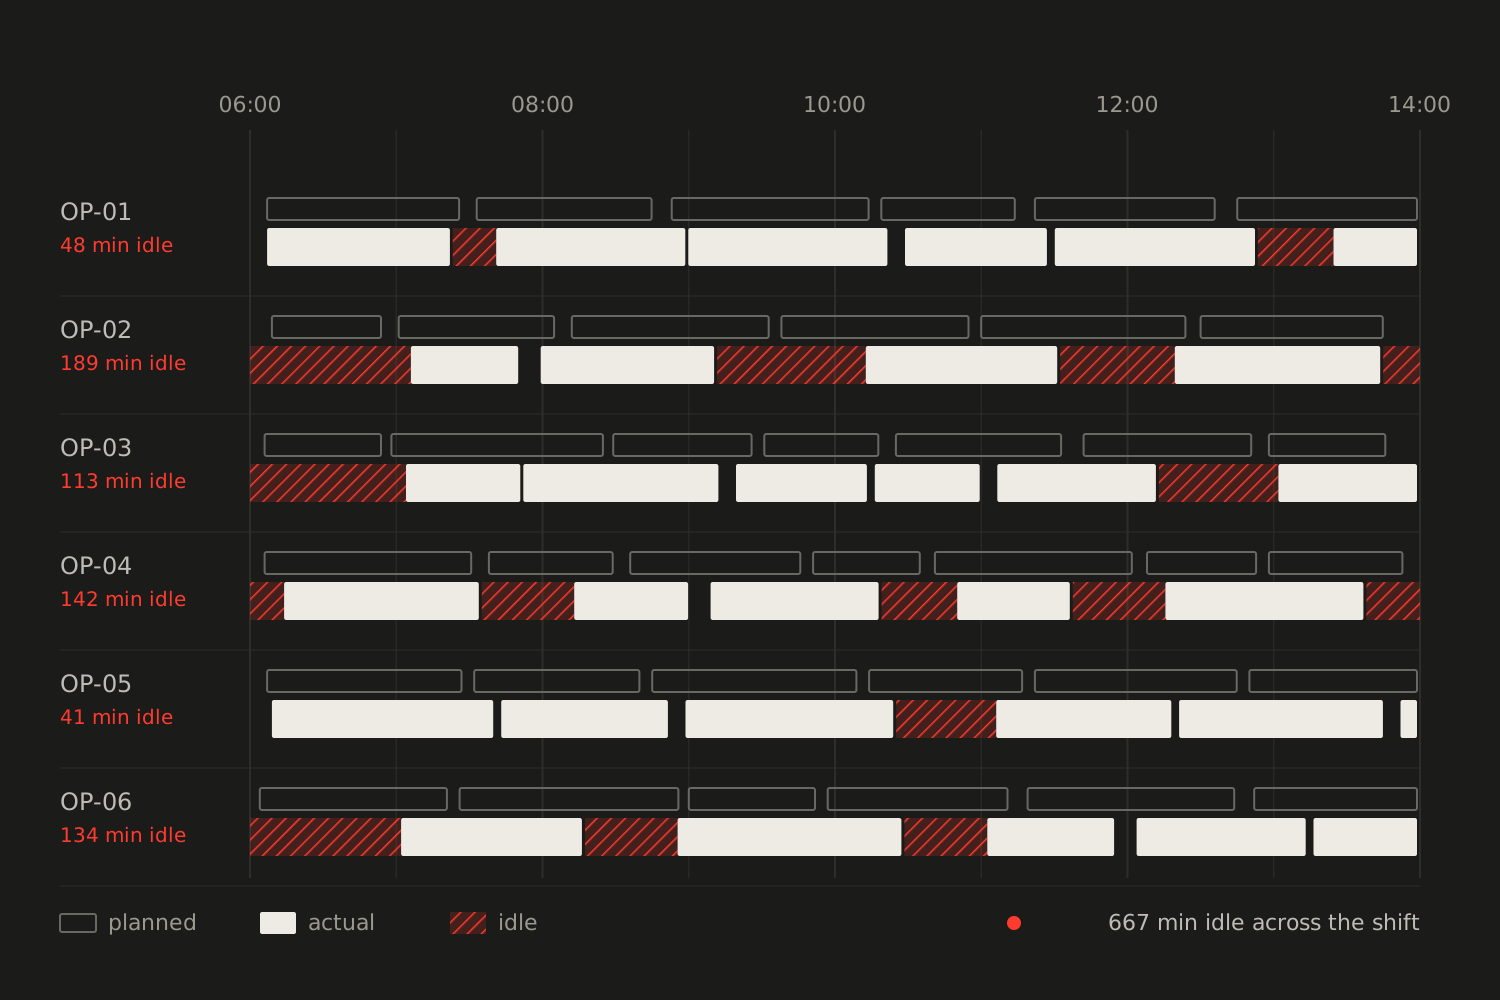
Where does the time on the line actually go?
A timeline of planned against actual activity, with idle time broken out per operator.

A selection of tools we have built, each on data the client already held.
A timeline of planned against actual activity, with idle time broken out per operator.
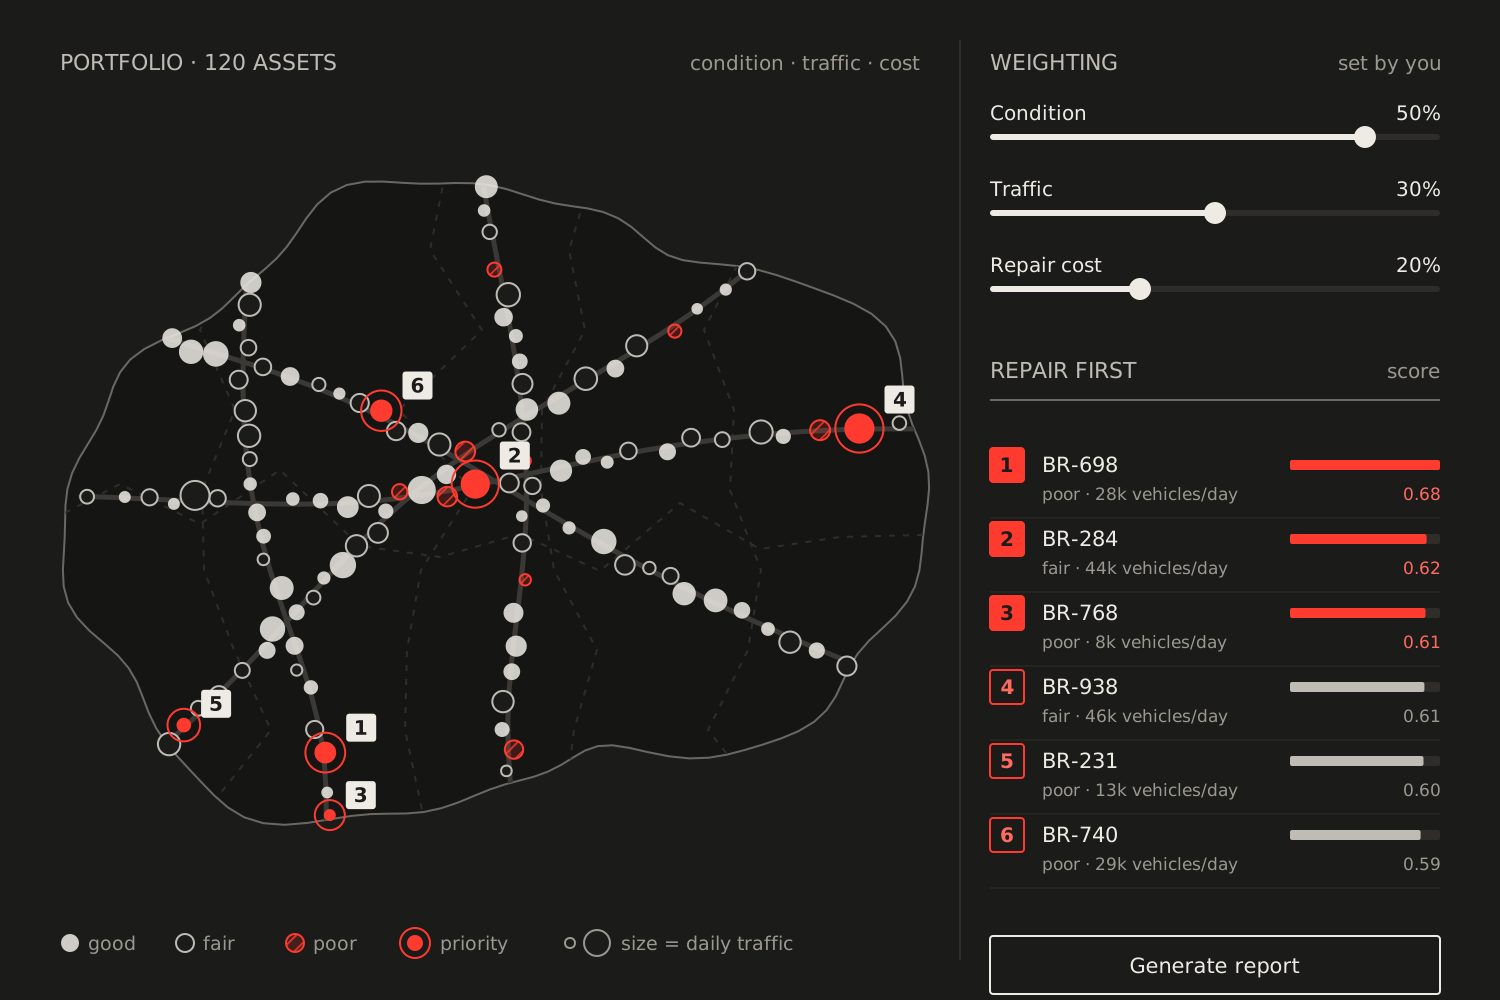
One view of the whole portfolio on a map, filtered by condition, traffic and cost, with reports generated from it.
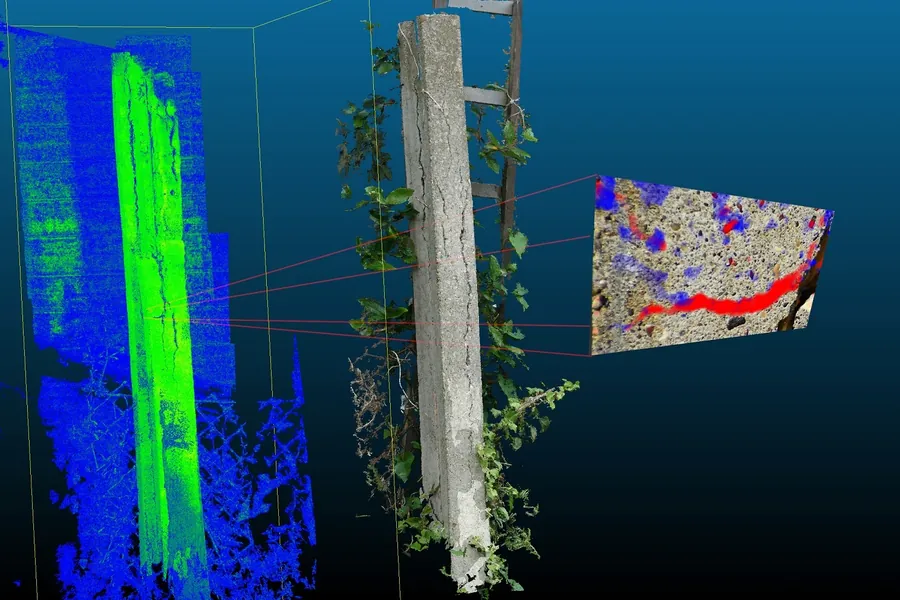
An analysis that takes any image source, flags defects such as cracks and leakage, and registers the images to the 3D model so changes line up over time.
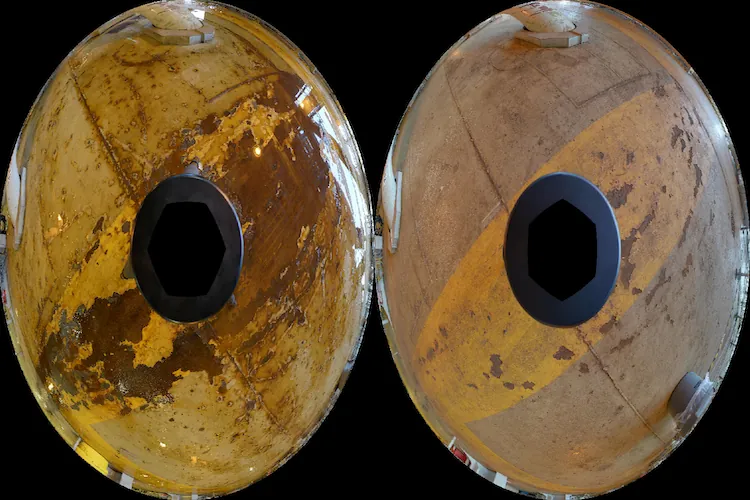
A comparison of the actual condition in the images against the digital models, flagging ongoing change such as rust and unexpected issues such as missing extinguishers.
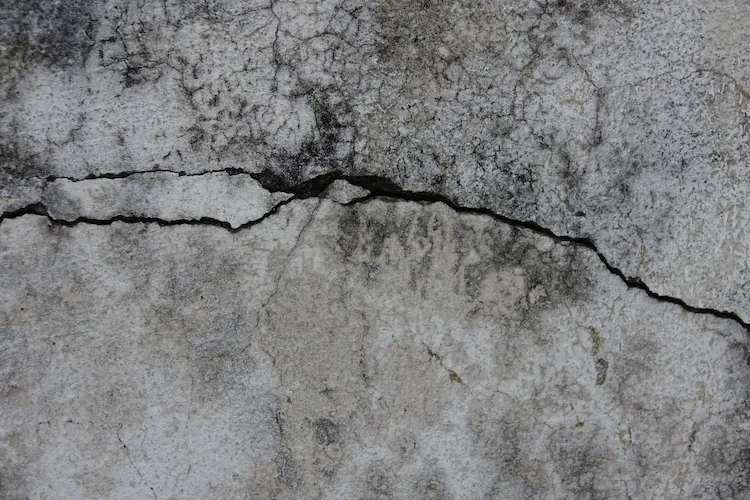
A damage map of each wall that tracks defects between visits, so maintenance can be scheduled before a failure.
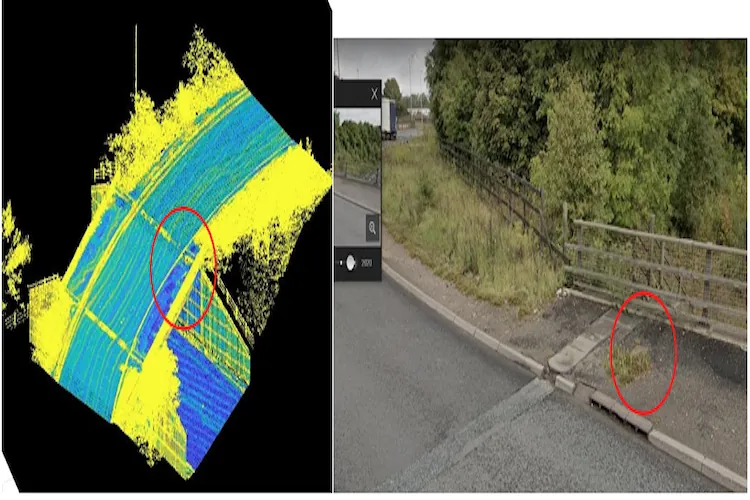
Detection of irregularities in shape and colour across the structure, pointing inspectors to the areas worth a close look.
What do you need right now from your data? Tell us.