
Which assets need attention first?
- Data
- Surveys, inspection records and cost figures, held separately by region.
- Built
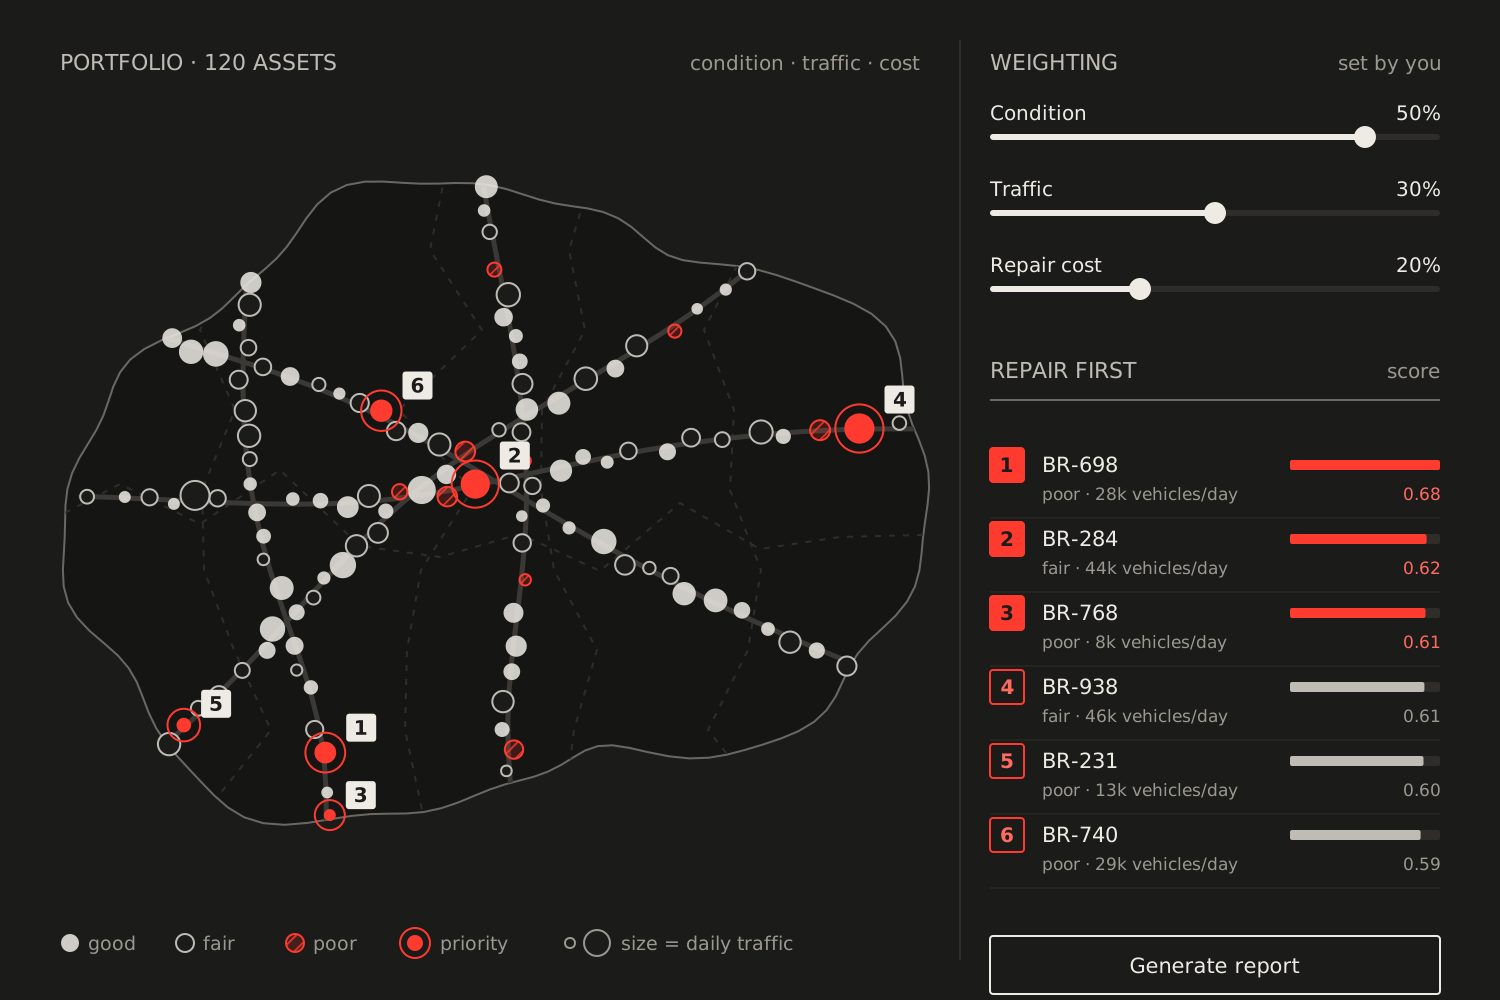
- One view of the whole portfolio on a map, filtered by condition, traffic and cost, with reports generated from it.
- Result
- In-depth analysis and mapping of the relationships between bridge characteristics.
The question
Large infrastructure programmes generate very large datasets: 3D scans, inspection reports, traffic and cost figures. Each was usable on its own, but nobody could answer the portfolio-level question that budgets depend on, which is what to repair first.
What we did
We brought the sources into one structure and put them on a map, so condition, traffic load and repair cost can be read together for any asset. The weighting is the client's to set: the view shows the effect of changing it, and the reporting comes out of the same place.
What it changed
A clear view of the data across the whole country, and an analysis of how bridge characteristics relate to their performance.